As a climate scientist I understand that our greenhouse gas emissions are impacting the climate. Like many people I try to minimise my environmental impact – I ride my bike whenever I can, I eat very little meat, and I used to care about food miles.
That’s right, I used to.
Food miles are easy to focus on, they’re easy to measure, and easy to explain. The only downside is that they’re a terrible way to estimate the total greenhouse gas emissions from food.
Apples are a great example. The UK imports a lot of apples from New Zealand – about $108 million (US dollars) worth in 2012. From the perspective of food miles, these apples are about as bad as you can get; it’s almost 18,000 km from New Zealand to the UK. There aren’t many countries that are farther apart than these two. Surely then, eating British apples in the UK must be much better for the environment. Right? Wrong.
This book by three New Zealand academics provides a summary of the energy use and greenhouse gas emissions from growing apples in New Zealand and the UK. First, let’s look at the emissions from transporting the apples to the UK.
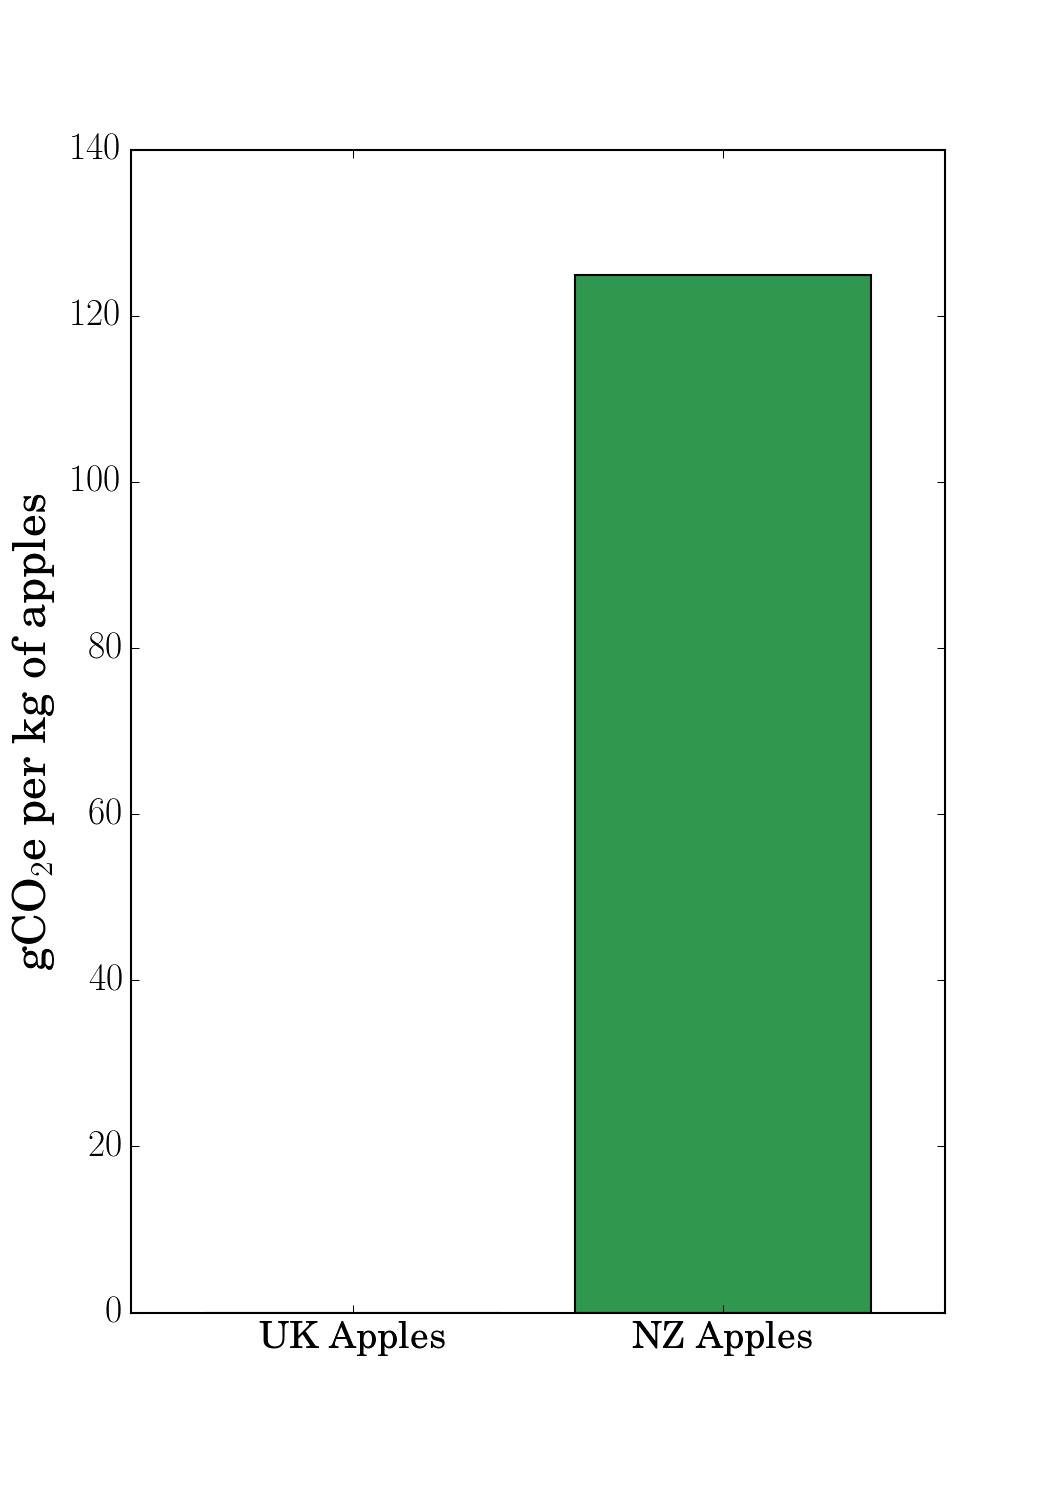
This looks pretty bad – there are definitely emissions caused by transporting the NZ apples to the UK.
But, how big are those emissions in comparison to the emissions from actually growing the apples? The next graph shows the emissions from growing and transporting the apples.
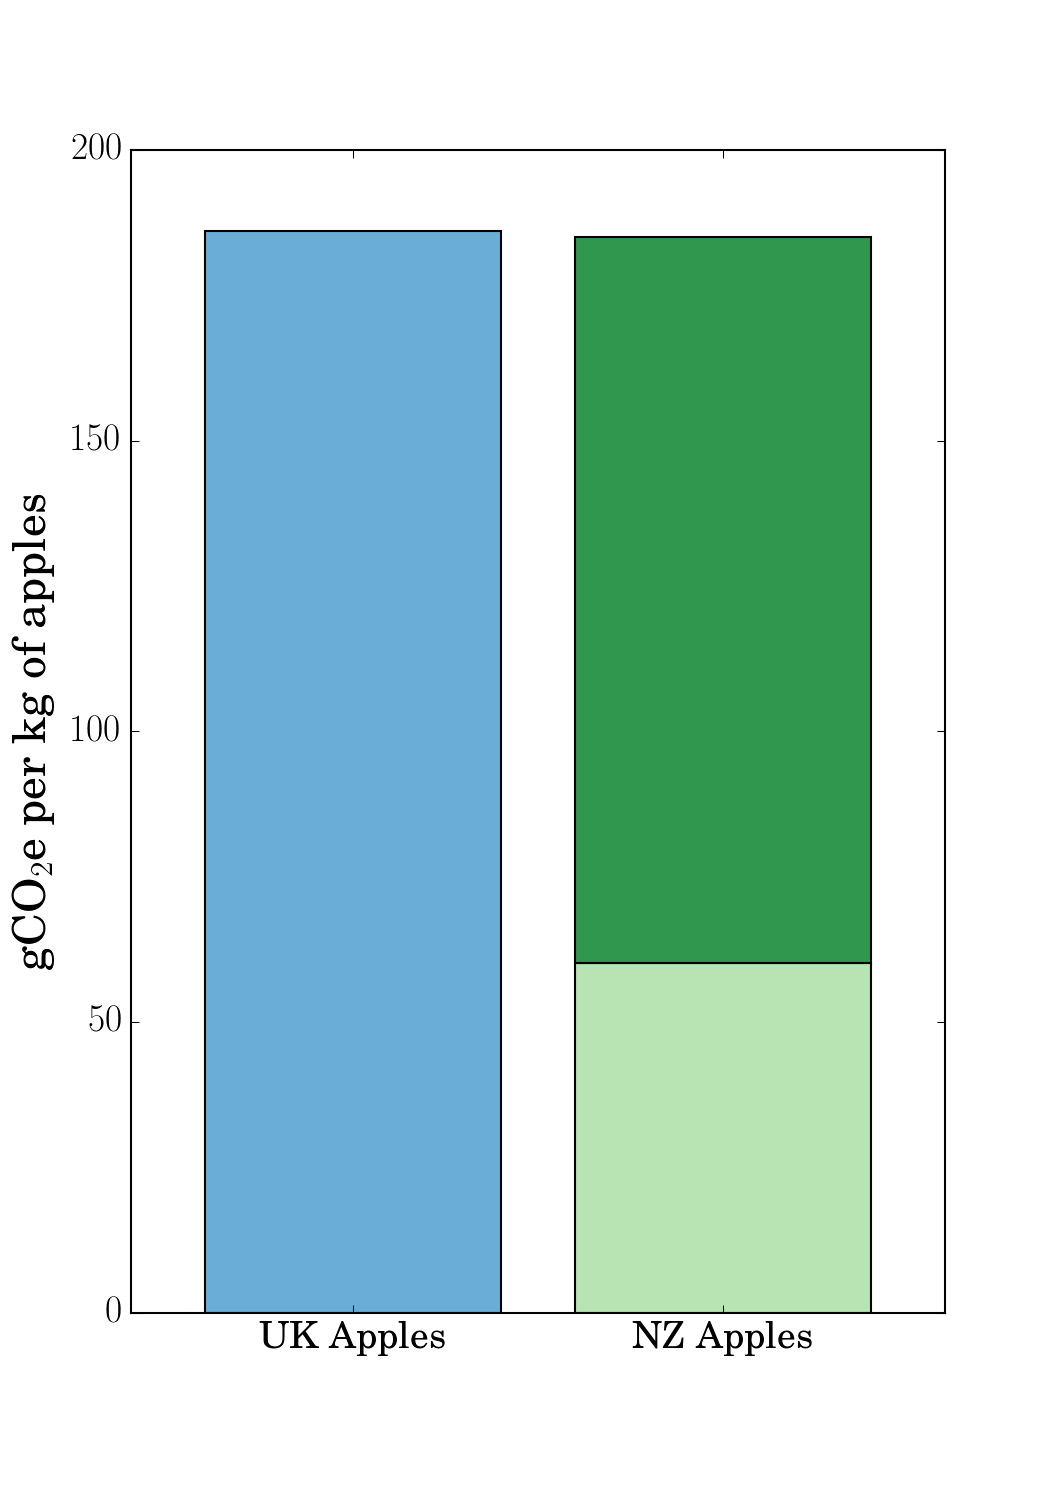
Now the two types of apples look pretty similar – it seems that food miles are definitely relevant. Maybe not the most important factor, but it looks like they shouldn’t be ignored.
But, earlier I said I no longer care about food miles – so what’s going on? The answer is that apples are a seasonal crop. They are harvested once a year, and then stored in large warehouses. To keep apples in good condition these warehouses have controlled atmospheres with low oxygen levels and low temperatures. It takes a lot of energy to maintain those conditions.
To make a fair comparison between apples from the UK and NZ, we need to know how long they’ve spent in storage before we buy them. Apples in New Zealand are picked between February and April, while apples in the UK are harvested between August and October. By knowing when apples are harvested and using information from Saunders, Barber and Taylor (2006) about the emissions released by storing apples it’s possible to work out the total emissions for apples eaten in each month.
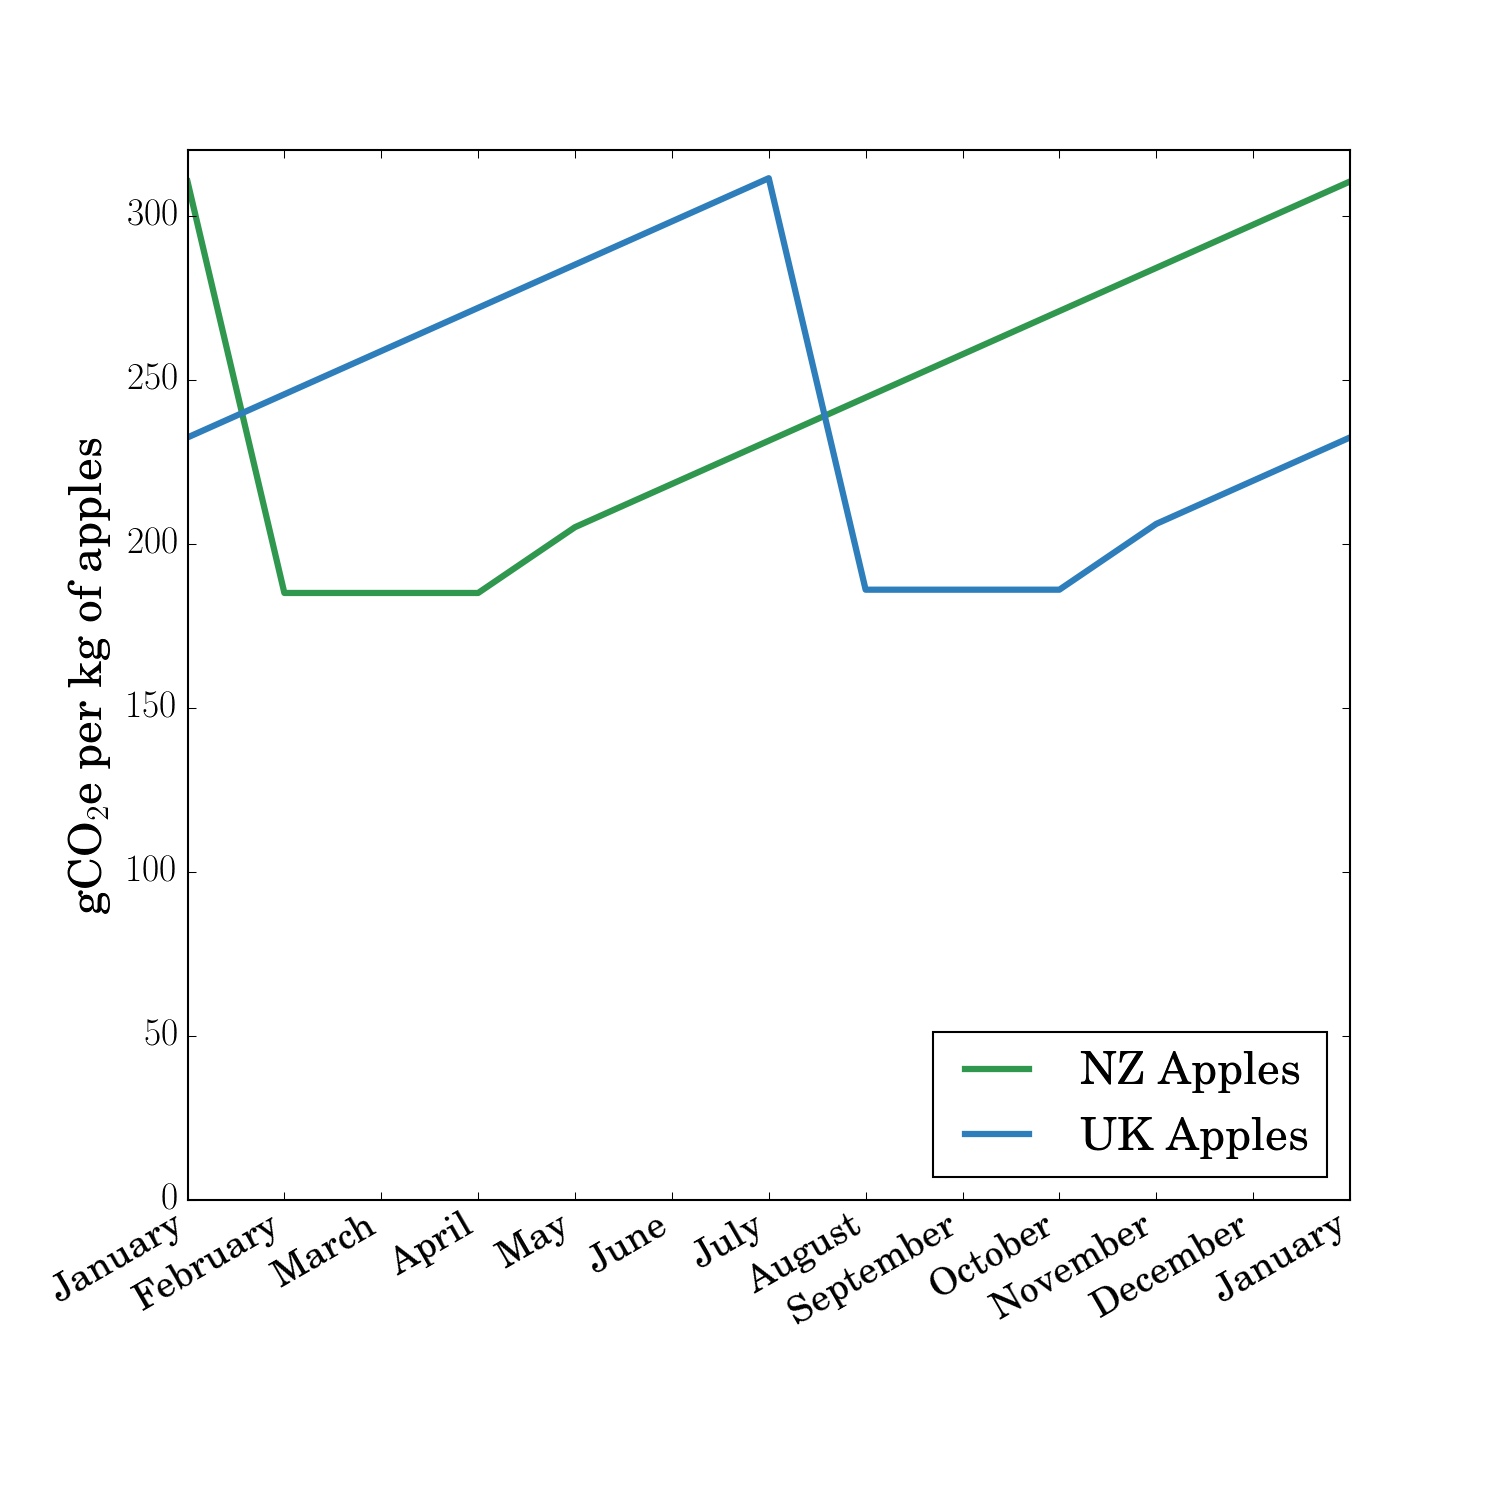
The greenhouse gas emissions from storing apples means that it’s better for the planet if I eat New Zealand apples between February and July. I was pretty surprised by this.
For six months of the year thinking only about food miles would give you the wrong answer.
Update: Geoff asked a great question about the total impact of eating UK apples all year compared with eating the lower emissions choice. Some quick internet searching reveals that there are about 6 apples per kilogram, so eating an apple a day is about 1 kg of apples a week, or 4.3 kg of apples per month.
The total emissions from eating only UK apples is about 12.4 kg CO2e per year.
The total emissions from eating the lowest emissions apples is about 10.4 kg CO2e per year.
The difference is fairly modest in absolute terms – 2 kg of CO2e is a bit less than is released by burning one litre of petrol – but large in relative terms – about 20%.
References
MIT ATLAS: http://atlas.media.mit.edu/explore/tree_map/sitc/import/gbr/nzl/show/2012/
Saunders, C., Barber, A., & Taylor, G. (2006). Food Miles – Comparative Energy / Emissions Performance of New Zealand ’ s Agriculture Industry.
If you’re a details person and are interested in looking at the workings behind these graphs, they can be found here.

Interesting facts, Ed! To my way of thinking, greenhouse gas emissions are only a part of the food miles issue. As a child of the ‘frozen peas generation’ (frozen veggies were first available to my mother’s generation of family cooks, so we ate a lot of frozen peas and corn) I got used to eating things out of season and thought nothing of eating things from overseas when these were available. Recently my thinking has changed, partly due to reading the story of a family in the U.S. who lived for a year on either local, in-season produce or home-preserved food. It was so restrictive compared with the variety of food we eat, but was definitely ‘food for thought! Eating things that are in season locally, grown by ourselves or by local producers, means fresher and tastier food.
Thanks!
I absolutely agree – eating truly fresh food is wonderful. For me the issue is the way that food miles always imply that local food is better for the environment. The point I was trying to make was that there are all sorts of hidden emissions in production of food that are often ignored.
There’s some really interesting research on the emissions impact of driving to the local supermarket compared with driving to a (slightly less) local farm – hopefully it will make it into a future post.
Also, eating only home-preserved or in-season food is a pretty serious commitment. Did one of the parents spend their entire time dealing with food?
I think you made the point very effectively about the hidden/ignored emissions related to food production and storage. I think you’re right – food miles do seem to imply that local food is always better for the environment.
In the scenario I mentioned, the whole family helped with food production (the younger children not as much) but not full-time. They were each allowed one ‘luxury’ item to take into the ‘experiment’ – e.g. tea. At times they all found it really difficult, and they did eat out occasionally.
What’s the relative difference between eating only UK apples and a location-optimized approach? ie., assuming one eats apples all year round, what’s the integral of the blue curve minus the integral of the minimum of the blue and green curves, divided by the integral of the blue curve?
Great question! I’ve put an update at the end of the post with the integrated emissions. The difference works out to be about 20%, or ~2 kg CO2e per year.
Very interesting article. Thanks! The main thing I think is missing from your argument is WHY such a disparity b/w UK and NZ CO2 due to “growing”? The answer: Yield per hectare. According to the ref’d article, you can grow way more apples in NZ likely due to climate than you can in the UK. So essentially the NZ trees are more efficient. How much more? Yield per hectare (14 tonnes in UK and a whopping 50 for NZ). Roughly a 3x factor, which seems to be about the same factor as the light green (~60gCO2) of NZ production to the blue (~180gCO2) of UK production (shown in your Fig. 2). This is the crux of the whole thing. So conclusions? Buy seasonal, from the source that has the most yield per hectare, which may or may not be local.
(okay I admit there is some issues with this broad conclusion…mainly: comparing production in 2 developed nations i.e. NZ and UK you can cancel out production inputs, but comparing developing nation production to developed nation production…like NZ and Thailand…you might have an imbalance that you’d have to account for…not sure). For now, to keep it simple I’m with the above conclusion! Thanks for an interesting read!
You might also want to mention that this is apple specific. In the ref’d report, onions for instance are better from the UK. I’m sure it differs from product to product.
The details…
IMO the ref’d article seems to be biased to NZ (for obvious reasons…look at the publisher) and seems to be slightly flawed in other respects, but luckily still gives roughly the same conclusions! For instance, all the adding up of direct energy inputs they do for the NZ apple production likely leads to some pretty big error propagation. They should have taken the same approach as they did with the UK data…looking at more bulk values of fuel used. Then we’d be comparing “apples to apples” as the saying goes ;-). They also account for 6 mo. storage of UK apples needed to match the growing season of the NZ apples. How about the 6 mo. storage needed for NZ apples to match the UK season?! They both cancel. Regardless, as above, it all boils down to the yield per hectare…because why would there be such a large difference in production (i.e. fertilizer, machinery etc.) inputs?..the Kiwis and Brits are just as technologically advanced in their apple production I would assume (more or less).
Thanks Chris. Glad you liked it. I thought it was pretty interesting 🙂 Your broad conclusion is pretty much the conclusion I came to as well – non-local in season trumps local out-of-season.
I agree that the article was a bit biased towards NZ – the comparison they do for apples is at the best possible time of year for NZ apples – but in general it seems alright. I’m not sure I agree about the errors becoming unreasonably large from looking at the individual inputs – farmers are pretty consistent with their activities from year to year, so I think it’s pretty reasonable to base the estimates off their specific activities. Especially if the farm produces lots of different crops and buys common inputs in bulk. The fact that the NZ emissions per area are about the same as the UK seems to me to be a (crude) validation of their method – farms in countries with similar levels of development should be pretty similar, which like you said, brings it back to yield.