The greenhouse gas emissions from food can be substantial – but how much do they vary between different types of food? And how do they compare with other emissions, say from driving to a scenic spot for a barbecue?
The story: Four friends are having a barbecue – they’ve found a lovely spot, collected some wood and brought things to grill. Between them they’ve got four different individual servings: one is beef, another is quorn (a popular meat alternative in the UK), the third is halloumi, and the fourth is chicken.
In this scenario what creates the most emissions? Before we work out the answer, you should have a guess.

Here are the details (with links to some pretty tasty sounding BBQ recipes).
- 160 g of Beef (Stephanie Alexander’s beef sandwich)
- 400 g of Chicken (Stephanie Alexander’s grilled coriander pepper chicken: one quarter of a 1.6 kg bird)
- 125 g of Halloumi (grilled halloumi recipe)
- 166 g of Quorn (Quorn grilled “chicken” fillets)
- 30 km of driving shared between four (7.5 km of driving per person)
- 4 kg of firewood shared between four (1 kg of firewood per person)
Once you’ve decided on an order, skip ahead to see how well you did. While I think the following snippets are really interesting, they’re mostly here to provide a buffer between the question and the answer.
What affects the emissions for each of the items mentioned above?
Beef
The emissions intensity of beef depends on how the cattle are farmed; pasture fed cattle produce more emissions than grain-fed cattle per kilogram of meat (Capper, 2012). Pasture fed cattle take longer than grain fed cattle to reach slaughter weight and because their food is less easily digested, they produce more methane per day (Nguyen et al., 2010). These methane emissions are responsible for at least a third of the total emissions (Pelletier et al., 2010). Therefore, grain fed cattle produce beef with lower emissions per kilogram of meat. Beef that is produced as a byproduct of the dairy industry also has lower emissions because some of the emissions are assigned to the milk.
Chicken
Modern broiler chickens (chickens specifically bred for meat production) reach slaughter weight in six weeks (Kokoszyński & Bernacki, 2008). This means that they are very efficient at converting feed into meat; during their entire life they consume only 2 kg of feed per kilogram of body weight (Kokoszyński & Bernacki, 2008).
Halloumi
Like all cheeses halloumi is made from milk. The amount of milk required to produce one kilogram of cheese depends on the type of milk. It takes 11.30 kg of cow’s milk, but only 5.44 kg of sheep’s milk to make 1 kg of halloumi (Economides et al., 1987). Producing cheese from milk requires a significant amount of effort, which means that the cheese making process also produces some greenhouse gas emissions (Kim et al., 2014).
Quorn
I could only find one reference for Quorn, and it wasn’t very detailed. So your guess is as good as mine. Having said that, I’d put my money on the manufacturing process as producing a lot of the emissions.
Driving
If we assume our car gets 12 km/L, then the 30 km round trip takes 2.5 L of petrol. Each litre of petrol releases about 2.35 kg of CO2 (US Energy Information Administration). Producing that litre of petrol released about 265 g CO2e (Elgowainy et al., 2014), so we have a total of 2.63 kg CO2e per litre. This means that the total to divide between our four chefs is 6.6 kg CO2e.
Firewood
According to the UK biomass energy centre wood is 37.5% carbon, so 4 kg of wood releases 5.5 kg CO2 when it is burnt. I’m going to skip over the question of biofuels being almost carbon neutral, since this is only here for a comparison – but it is a question that deserves to be properly discussed.
The result
The graph below shows the emissions from one serve of each of the foods and the per person emissions from the firewood and driving.
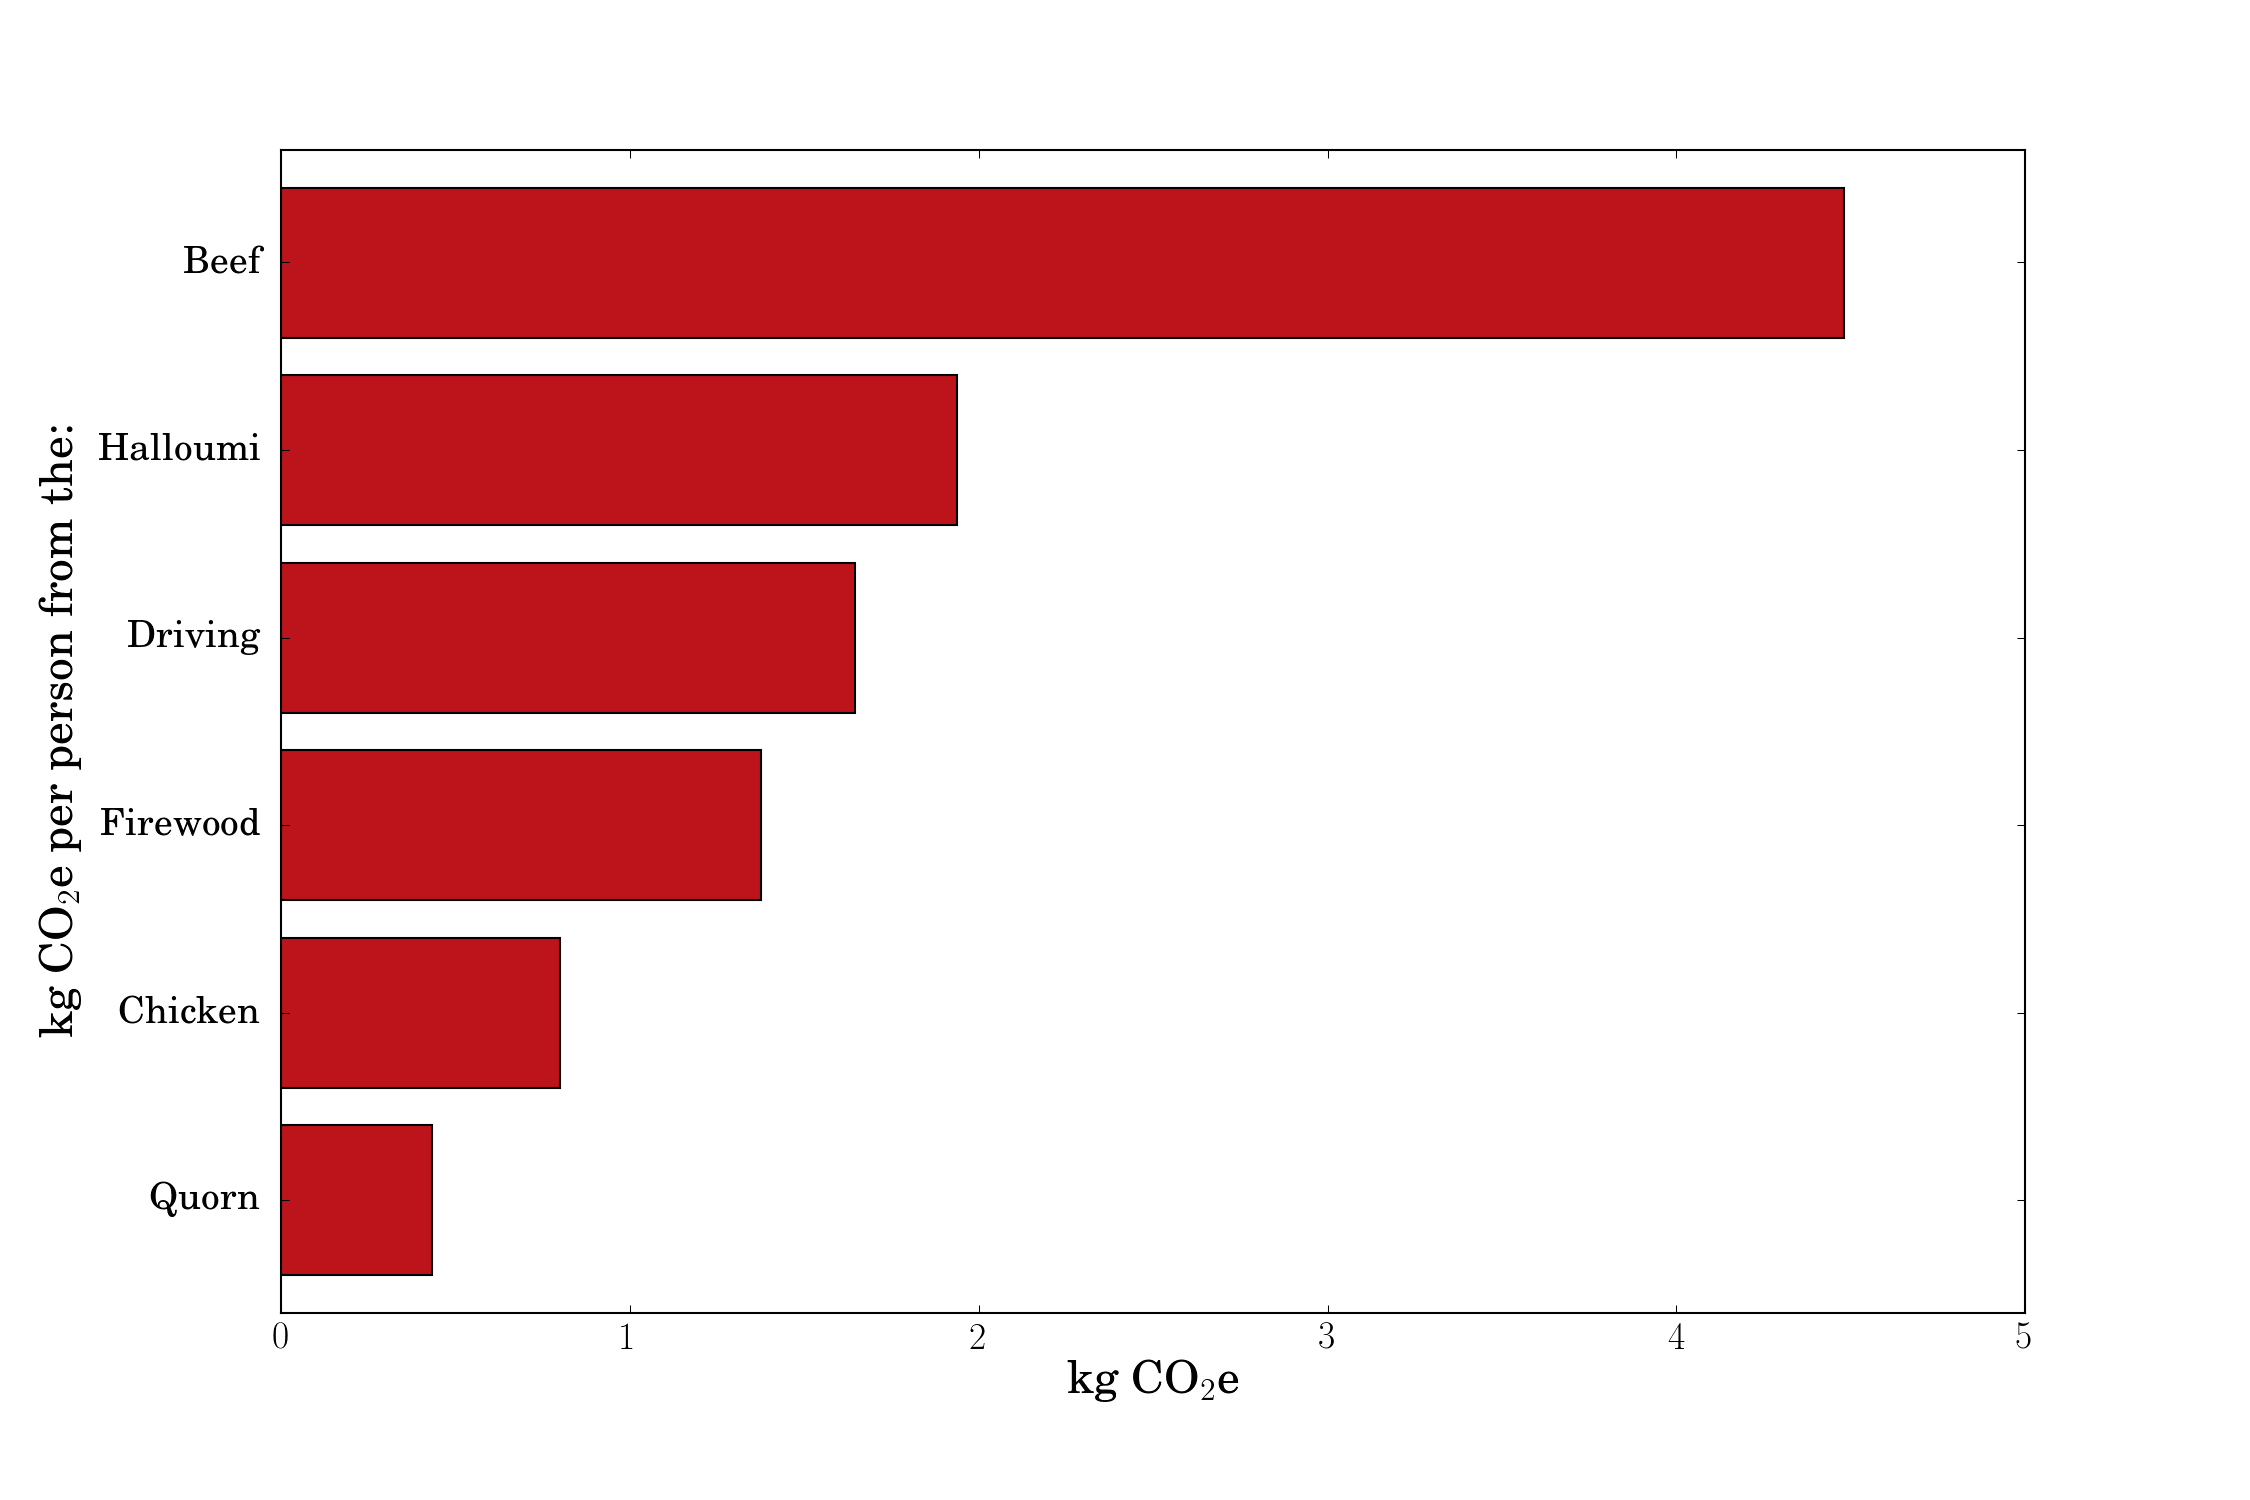
How well did you do?
I didn’t do particularly well; I was expecting the beef to be bad, but I put the the halloumi and the chicken in the wrong order. I also hadn’t expected that the halloumi would be worse than the driving.
In a previous post we worked out that eating an apple a day produced about 10 kg CO2e over an entire year – which is roughly equivalent to the emissions from 400 g of steak. Food choices can make a difference, but it seems apples aren’t very important in the grand scheme of things.
Other foods
While doing the research for this post I found lots of estimates for other foods, so I put them in a graph too. This one is per kilogram of food, rather than per serve.

Once again, if you’re a details person you might like to look at this IPython notebook which explains exactly what I did in lots more detail.
References
Capper, J. L. (2012). Is the Grass Always Greener? Comparing the Environmental Impact of Conventional, Natural and Grass-Fed Beef Production Systems. Animals, 2(4), 127–143. doi:10.3390/ani2020127
Economides, S., Georghiades, E., & Mavrogenis, A. (1987). The effect of different milks on the yield and chemical composition of Halloumi cheese.
Elgowainy, A., Han, J., Cai, H., Wang, M., Forman, G. S., & DiVita, V. B. (2014). Energy Efficiency and Greenhouse Gas Emission Intensity of Petroleum Products at U.S. Refineries. Environmental Science & Technology, 48(13), 7612–7624. doi:10.1021/es5010347
Kim, D., Thoma, G., Ulrich, R., Nutter, D., & Milani, F. (2014). Life Cycle Assessment of Cheese Manufacturing in the United States. lcafood2014.org, (October), 3–9.
Kokoszyński, D., & Bernacki, Z. (2008). Comparison of slaughter yield and carcass tissue composition in broiler chickens of various origin. Journal of Central European Agriculture, 9(1), 11–16.
Nguyen, T. L. T., Hermansen, J. E., & Mogensen, L. (2010). Environmental consequences of different beef production systems in the EU. Journal of Cleaner Production, 18(8), 756–766. doi:10.1016/j.jclepro.2009.12.023
Pelletier, N., Pirog, R., & Rasmussen, R. (2010). Comparative life cycle environmental impacts of three beef production strategies in the Upper Midwestern United States. Agricultural Systems, 103(6), 380–389. doi:10.1016/j.agsy.2010.03.009
Verge, X. P. C., Dyer, J. a., Desjardins, R. L., & Worth, D. (2009). Long-term trends in greenhouse gas emissions from the Canadian poultry industry. The Journal of Applied Poultry Research, 18(2), 210–222. doi:10.3382/japr.2008-00091

Well put together Ed!! I was able to follow the logic, so it shoud appeal to the wider community…! Is this going to be part of your book, or did you put this up prior to that being offered?